
Interpreting Covid-19 numbers in Applied Statistics classes
Covid-19 is on everyone’s mind so it’s only natural to talk about it, at home and at work. Dr Nikolai Bode, Vice Chancellor’s Fellow at the University of Bristol, shares examples he used to discuss Covid-19 numbers with students on the Applied Statistics unit in Engineering Mathematics.

One of the most prominent figures in recent news has been the number of Covid-19 cases. In Statistics, we call these observational data, because they are recorded directly in the population and not within a controlled setting (that would be an experiment). Recording the number of cases is important, because it allows us to track and perhaps predict the development of the pandemic.
More information
Applied Statistics abounds with protocols for collecting observational data systematically. These protocols ensure data can be used to answer the questions we are interested in. For example, we could randomly choose a large number of people in fixed time intervals and test all of them, regardless of whether they display symptoms or not (this is called simple random sampling). If we pick enough people, statistical theory guarantees we get an accurate estimate of the overall number of cases. Unfortunately, from a statistical perspective, testing was typically performed differently. For example, people with symptoms or healthcare workers were tested first and these testing protocols changed over time. While this approach may make sense from a public health perspective, for estimating the total number of cases in the population, they are not so useful, as has been documented elsewhere . Different testing protocols are now being used to estimate more reliably how many people have had the disease.
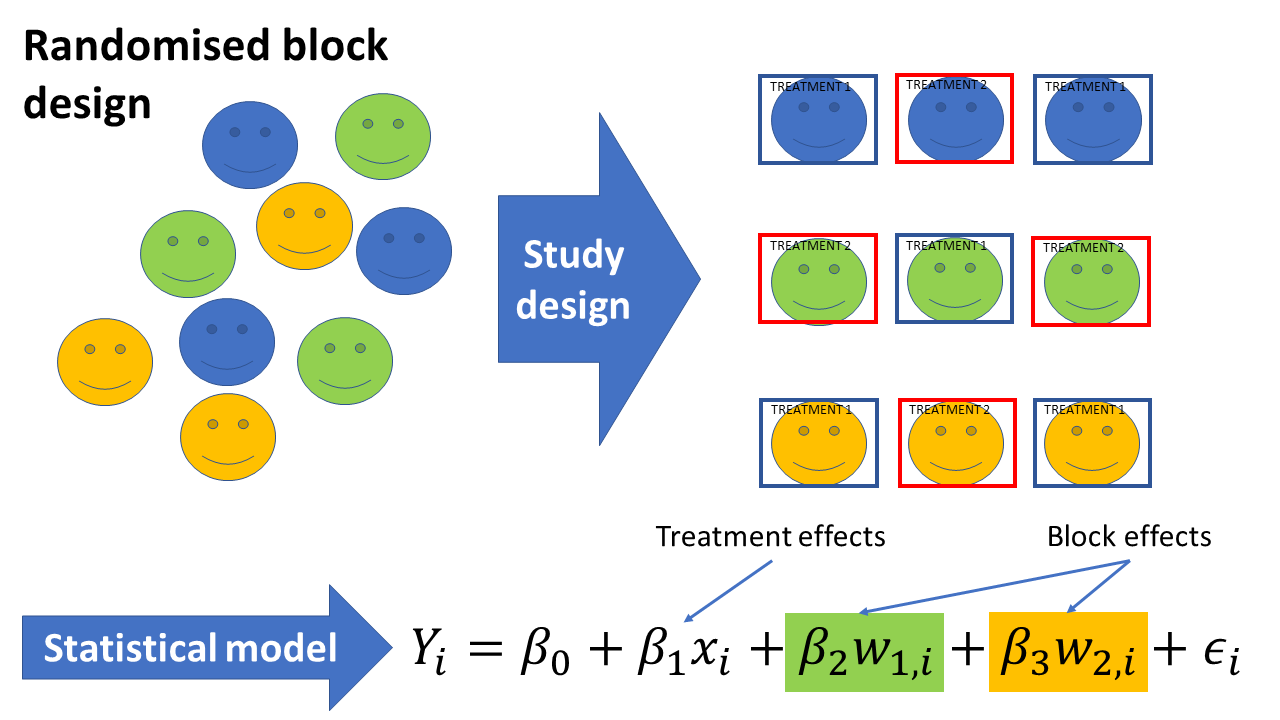
Hopefully, scientists will succeed in developing a vaccine or at least effective medication soon. Testing the efficacy of treatments leads us to the second example we looked at in Applied Statistics classes: collecting data in a controlled way to answer a specific question, or experimental design. For example, efficacy may depend on age or existing health conditions. To assess this rigorously in a cost and time-effective way, we could design a study that tests the treatment in different blocks of participants who all share the same characteristics (e.g. similar age or existing health conditions). Statistical models, a technique we covered in the course, can then be used to measure treatment effects both within and between such blocks of participants and make sure they are different to what we would expect by chance (see figure below).
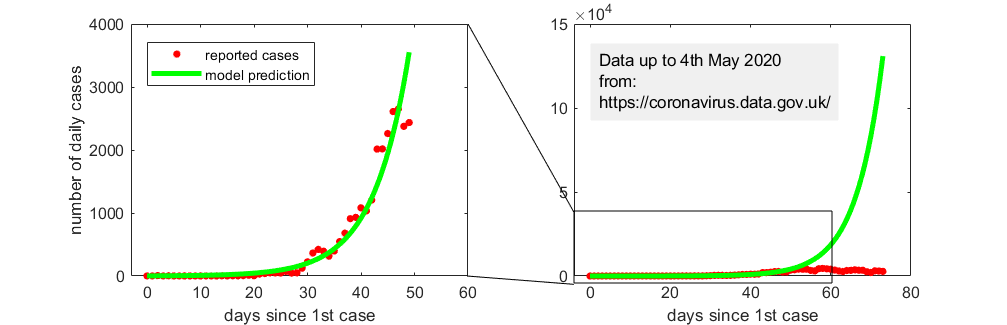
At the start of epidemics, the number of cases often increases exponentially (as is the case when the infamous R0 is larger than 1). The last example we looked at was how we can use statistical models to test whether this is the case. For example, a model might assume that due to measurement errors the number of observed cases over time are distributed around an exponential growth curve according to an appropriate probability distribution. In other words, the number of cases does not increase perfectly, but roughly exponentially. We can then investigate whether this assumption is supported by data or even when it stops being supported by data. Thankfully, looking at the reported number of cases in England, exponential growth ended in April 2020, around 50-55 days after the first case (see figure below).
Hopefully, these examples illustrate how Applied Statistics can be useful in making sense of Covid-19 numbers. And there are many additional ways in which Applied Statistics can help research into the pandemic. They range from assessing the risks to different groups in the population to make predictions for the spread of the disease. As our societies adjust to this new disease, it is re-assuring that we have statistical tools to provide answers to many of our questions using data.